You already know the chart. Some three-letter coin with a dog on it, didn't exist on Tuesday, up 300% by Thursday lunchtime on volume that came from nowhere, and by Sunday it's a flatline and a Discord full of strangers calling each other family. Crypto does this dozens of times a day, down in the low-cap perps nobody serious bothers watching. That's the whole business plan, more or less.
The words "alpha" and "edge" make me cringe. We're all just seeking money; the Greek letters are there to make it sound like more than that. So read the title accordingly.
For the past two months I've been building a system to short those pumps. The thesis is about as simple as it sounds: most of these low-cap shitcoins fade after they spike, so we sell them. I didn't come up with it. I lifted it off Scott Phillips on his most recent podcast. He made the point that the big liquid coins trend and the small ones do the opposite: they show negative momentum effects. I took his word for it and went and explored it myself.
I didn't build this alone. A lot of the load was carried by AI, mostly Claude and Codex, which are good at opposite things. Codex is the creative one: it proposes its own angle on a signal and goes hunting for fresh ideas, great for exploration. Claude is the pessimist: point it at the code and it finds the bug, explains why the idea was doomed anyway, then finds a bug in that explanation. Annoying at first, but a useful attitude to have near a backtest.
The strategy
We run a full point-in-time universe: every coin that ever traded, held in the data at the size and rank it really had on the day, including the ones that later delisted, got renamed, or quietly died. Test only on the coins that still exist today and you are testing the survivors. In a market that is mostly coins that don't survive, that hands you a fake answer for free.
Then the filters. Exclude the top 30 most liquid names. The big caps trend instead of reverting, so the reversal we're trading isn't up there. Then a volume floor so we don't take too much market impact and slippage on the way in; I found 3M to be a reasonable threshold. Then the signal itself: a coin suddenly pulling in way more flow than it ever used to, turnover blowing out to around 6× its average over the previous week, climbing a long way up the liquidity ranks in a few days, popping hard on its own rather than just floating up because Bitcoin floated up, and closing strong instead of wicking up and dying. The idea is that somebody bought late and got greedy, and that runs out.
The hard-coded numbers bothered me for weeks. The 6×, the rank jump, all of it hand-picked. It felt like curve-fitting, drawing the bullseye after the arrow already landed. Then I realised everybody has them: Jane Street has hard-coded numbers tucked away somewhere too, there's no magic parameter-free strategy sitting out there waiting. And every time I tried to make a number adaptive it just got worse, because a variable threshold needs a volatility estimate, which needs a lookback window, which needs its own tuning. I'd rather have one number I can actually see than three hidden ones quietly overfitting where I can't.
Short fade · 3× leverage · in-sample · Bybit · 2023-06 → 2026-06
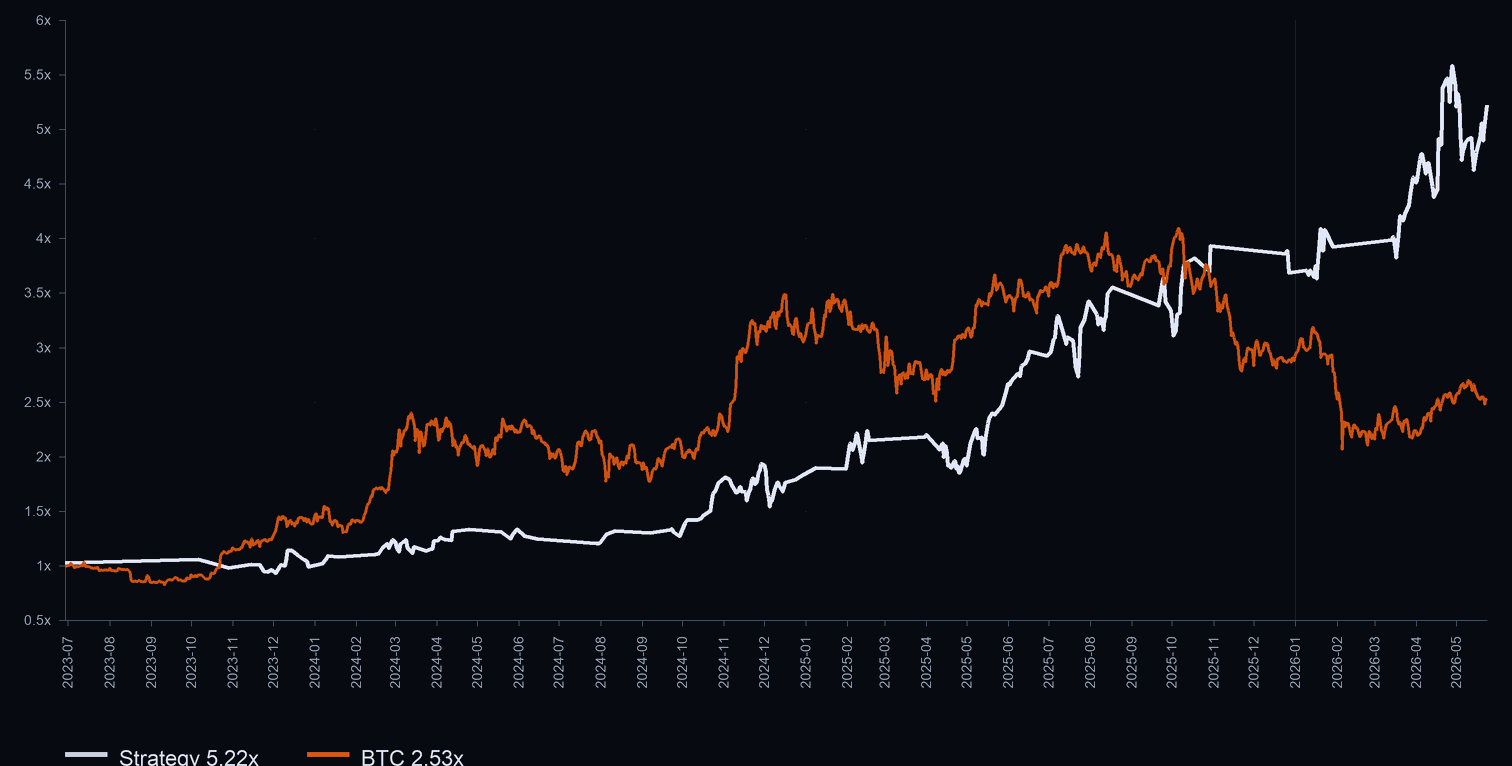
Best +38.5% (Oct ’24) · worst −9.3% (Apr ’25) · 20/31 trading months positive
The entry is where I was wrong the longest. We do not short the top. We do not catch knives. We wait and go in at the daily close plus one hour, on purpose, in a quiet stretch of the day so the volume and the price aren't both shoving against us at once. You let the pump calm down before you lean on it.
The exits are nothing special. A hard stop at 12%. A failed-fade cut: if a trade's been open six hours and never once gone my way and I'm more than 4% down, I kill it there instead of feeding the full stop later. A rank-decay exit that lets a name out once the signal that put it on the book has faded, so a position that has quietly stopped working doesn't just sit there to the time limit. And a three-day cap on top, so nothing overstays.
The best single thing I found wasn't an entry trick or an exit trick, though. It was age. Only short coins that have been around a while, roughly 300 days or more. Brand-new listings squeeze shorts like their life depends on it; they're the ones that rip another 80% after you think it has run out of steam. The fade only behaves on names that have already lived through their hype.
Chasing speed
I didn't want any of this slow, boring stuff to start with. I wanted a machine. A continuous observation engine, websockets only, a colocated box, the whole thing tuned for speed like I was on a prop desk: blazingly fast Rust and C++ libraries, Polars instead of pandas, every microsecond shaved off like it was sacred.
I built it. And it started buying pumps. I'd watch it open a short into something still going straight up. I tried to save it the obvious way, splitting the signal off from the execution and hunting for sniper entries that would wait for the fade to actually start before pulling the trigger. I didn't manage to make it work.
I went digging for why the continuous engine had ever looked good, because its backtest had been gorgeous, and I found a look-ahead bug worth about 25 hours. One of the features it ranked coins on was reading a candle that hadn't finished forming yet at the moment the model swore it was deciding. It had a full day of tomorrow already in its pocket. When I forced every feature to use only what was genuinely knowable at the instant of the decision, the lovely curve folded flat into a losing one.
Continuous engine · post-fix · exploratory · Bybit · 2023-06 → 2026-06
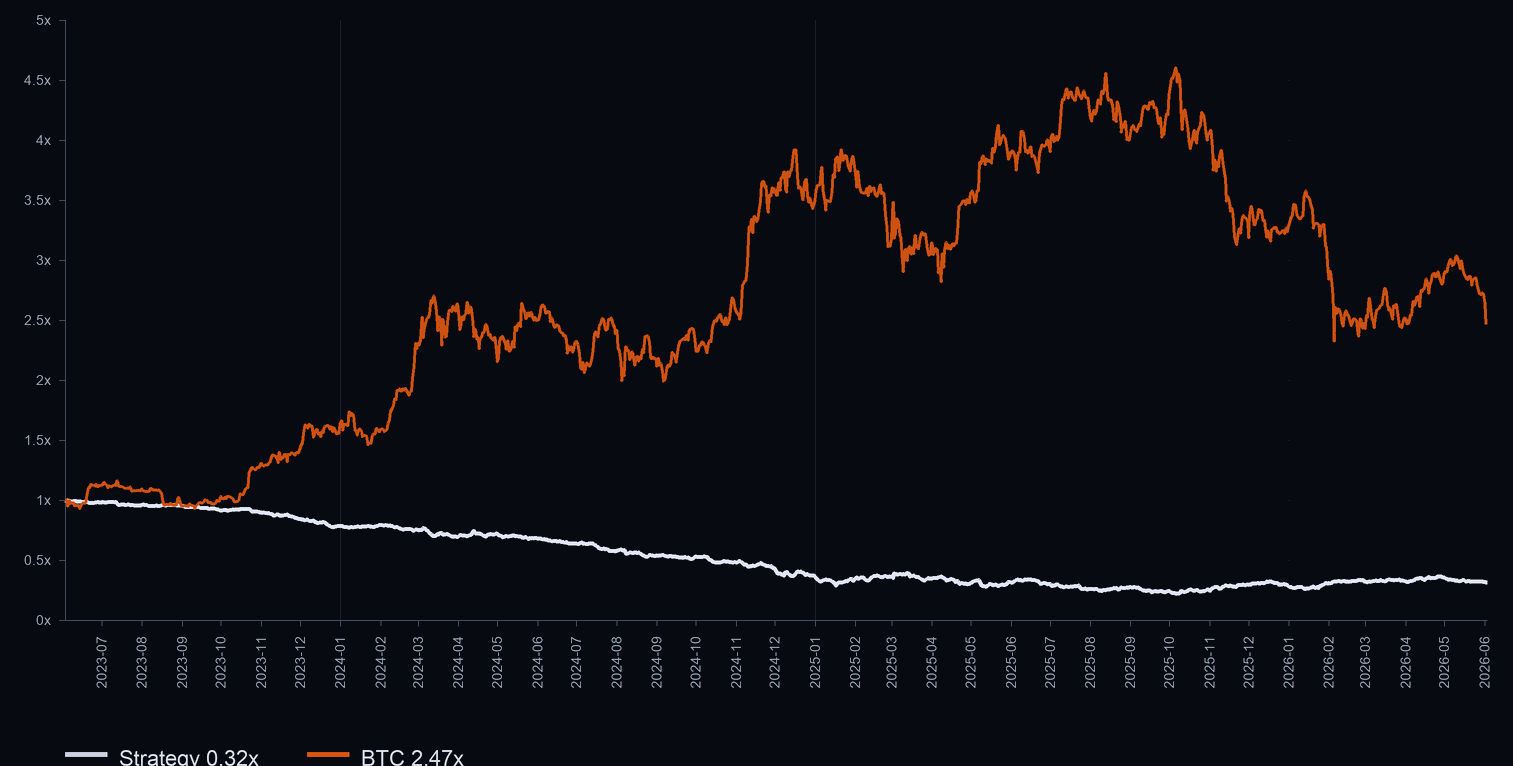
The same engine once every feature was forced to use only what it could have known at the instant of the trade. The gorgeous curve became this. A steady bleed to a −78% drawdown. I'm keeping it in on purpose.
So I switched the engine off and took the lesson, which was bigger than one dead machine. If you only pull the trigger once a day then speed buys you nothing, there's no race on, and it turns out the slowness is the actual point. Waiting that extra hour for the pump to wear itself out is the reason the trade survives at all. Being fast didn't help with any of it; it just got me to the bad trade faster.
The order flow rabbit hole
I've heard the real edge is in the order flow. The tape, who's hitting the bid, who's leaning on the offer, the imbalance the candles hide. So naturally I built the whole thing to read it: signed order flow, taker imbalance, aggregated up from the raw trade prints, the lot.
It was a project on its own. Pulling the raw trades point-in-time meant hundreds of gigabytes of old dirty data, crawling in overnight for days, my machine sounding like it was trying to leave the house. And after every test I could think to run, standalone, as a filter, as a sizing input, the signal was there but it was tiny. Real, and far too small to trade on by itself.
Order flow is a frequency game. At high frequency it's the whole edge: you're trading the microstructure itself, reading who's hitting the bid print by print. At one decision a day it barely registers, the flow that mattered has already come and gone by the time I act. So I shelved the whole pipeline. It was real, just too small to lead the book on its own, and I wasn't going to keep downloading hundreds of gigabytes a night to keep proving that to myself.
That was the lesson, in the end, and it is almost stupidly simple: the edge is mostly in which coins you pick, not the minute you get in. I tested it properly. My clever fade-confirming sniper entry against a dumb short-it-an-hour-after-the-close-and-go-to-bed, side by side, and at hourly resolution only 3 to 9 percent of the trades even came out different. The clever version added basically nothing. I'd spent weeks on the part that feels like skill, and it was the wrong part.
The other book
The long book is almost the same idea as the short, just flipped. The short fades a pump that's running out of steam; the long rides a pump that's still going, but only the strong ones, only when Bitcoin and ETH are both in a clean uptrend, and it shrinks its own size automatically when things get too wild. On its own it's modest, and it barely trades, maybe 60 to 70 days a year. It does hold up out of sample, though: run on Binance over 2021 to 2023, where the data goes back further than Bybit's, the standalone long returned around 40%. Bybit had too many gaps to test that far back.
Long FOMO-chase overlay · 3× leverage · in-sample · Bybit · 2023-06 → 2026-06
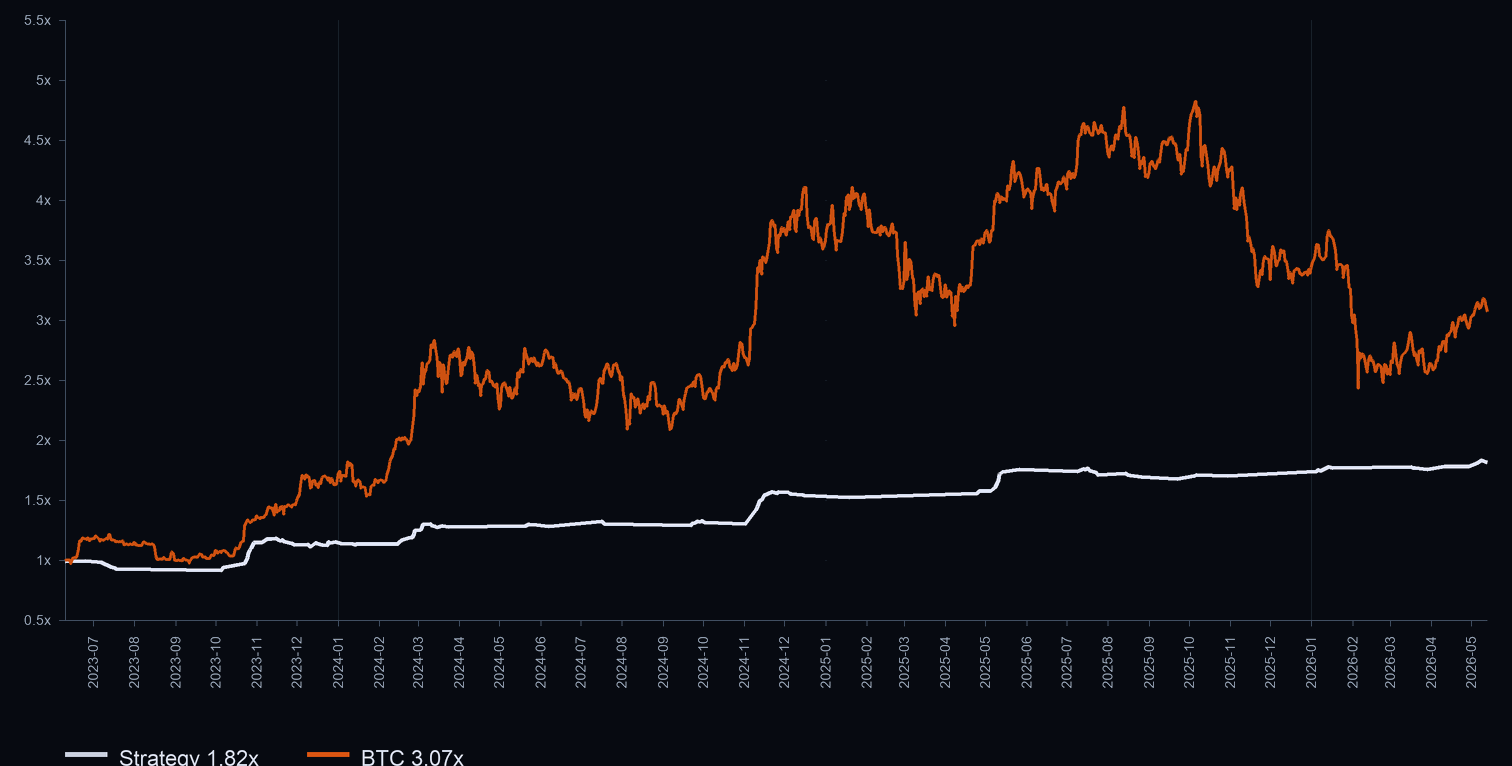
Best +23.8% (Oct ’23) · worst −6.7% (Jul ’23) · 14/26 trading months positive
I wouldn't run the long on its own. It's there to pull the combined book toward delta-neutral. It's almost perfectly uncorrelated with the short, slightly negative even, so it's green on exactly the days the short is bleeding. Run together, the two cancel a lot of each other's drawdown and most of the book's net beta to the market, which is mostly what stops you bailing at the worst possible moment.
What it taught me
The research taught me the lesson that actually stuck. At one point a run I'd set up came back and basically said shelve it, this is dead, and I nearly did. Then there was a long stretch where the strategy looked genuinely worthless in the backtest, returns gone, and I'd written it off. Turned out it wasn't the strategy, it was me. I'd quietly stacked three mistakes on top of each other: the worst possible fill on every trade, far too few positions so each loser hit like a truck, and the signal and the execution mashed together so I couldn't tell which one was failing. I fixed the measurement, left the strategy alone, and it stood back up. You can never be too harsh on a backtest. The one danger is letting that harshness put you off hunting for alpha in the first place.
Every time a number looked too good it turned out to be a bug. The gorgeous continuous curve was the look-ahead. The strong early numbers were survivors. Now, when a result looks great, my first move is to go hunting for what's broken, and more often than not, I find it. I keep an actual list of the mistakes I refuse to make again. 25 of them now:
A few off the list of 25
- The short side looks best on exactly the coins you can't borrow anywhere real. If the venue won't let you take the position, the edge was never yours.
- Anything with memory, trailing stops, profit locks, cooldowns, has to boot from the blank state the live system wakes up in, not one that's been warm since 2023.
- Twelve shorts open at once can quietly be one bet on the same market dropping. Watch the basket, not the trade.
- Test enough coins and windows and exit rules and one of them looks brilliant on luck alone. A single good run proves nothing.
- A backtest that won't line up against the live order lifecycle isn't proof. Backtest, paper, and demo have to agree fill for fill.
Where it stands
These are in-sample backtests, and I'll say so plainly. The short has no out-of-sample set for a concrete reason: go back far enough and the universe is too thin to run it. The strategy needs a deep field of low-cap names to pick from every day, and the early years didn't have one, so an older window would test a different, smaller market, not this system. The long is the exception, and it held up out of sample on Binance. It all runs on demo and paper, real-money path switched off, and the forward test takes over from here.
Here is the honest breakdown of the return. Part of it is a risk premium: shorting volatile, thinly traded names pays you for standing in a spot most people avoid, and anyone willing to hold that position earns some of this. That premium is the floor, not the whole number. On top of it sits a real edge, the part that decides which names to fade, when to stand aside, and how the regime filter and the basket are built. That selection is deliberate, and it is mine. The part that makes the curve worth trusting is the least showy: a point-in-time universe with the dead coins left in, fills taken at the worst price the bar traded, costs charged and then tripled.
The combined book
This is the one that actually matters: the short and the long together, both at 3× leverage, in-sample over three years. The short does the compounding, it's the higher-frequency book, and the long mostly takes the edges off the ride. Below is the whole thing broken open: the curve, the month-by-month, and every one of the 558 fills underneath.
Combined book · 3× leverage · in-sample · Bybit · 2023-06 → 2026-06
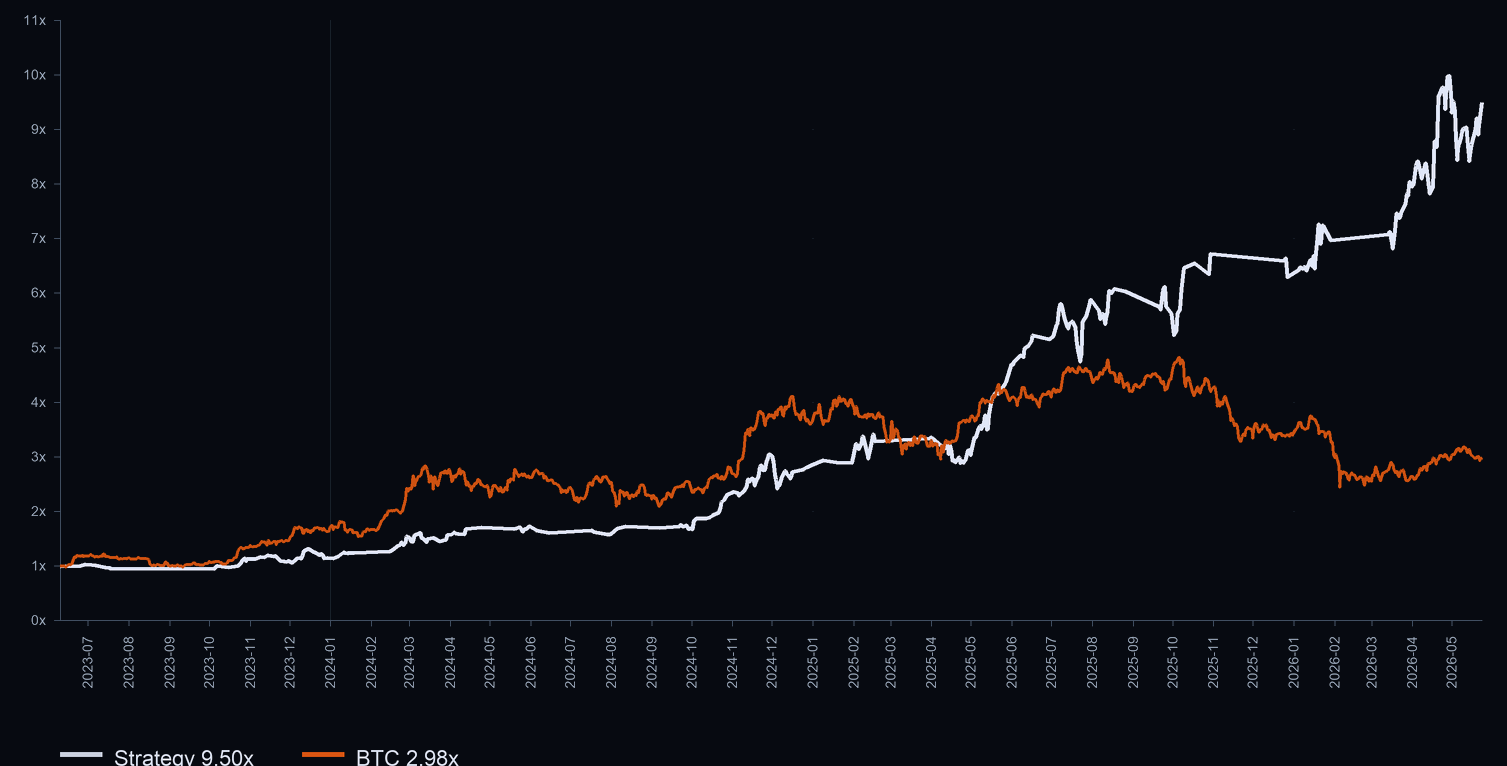
Best +47.0% (May ’25) · worst −7.4% (Jun ’24) · 22/32 trading months positive
Two mechanical fingerprints: a stop-loss wall where the 12% stop lands as a ~−3% book hit, and a take-profit tail at ~+6.5%. The mass leans right of zero, and that lean is the edge.
Mostly shallow, clawing back to new highs again and again, with one −20.9% hole it took ~110 days to dig out of.
The configuration
- Universe: full point-in-time, every coin that ever traded including the dead ones, top 30 by liquidity excluded.
- The short: a volume / liquidity migration event: turnover ≈ 6× its weekly average, a big jump up the liquidity ranks, a real move of its own, a strong close, only on coins 300+ days old, only when Bitcoin's 30-day trend is up. Enter at the daily close
+ 1h. Exits: 12% stop, a failed-fade cut at six hours, three-day max hold. Up to ~12 names at once. - The long: the mirror image, a FOMO-chase that rides strong pumps in a BTC-and-ETH uptrend, ATR-based stop and target, three-day hold, run as an overlay on top of the short rather than its own book.
- Everything is cross-checked independently on Binance, not just Bybit.
The assumptions, which matter more than the line does
- The curves are drawn at 3× leverage so the lines are legible side by side. That's pure leverage on the same signal, it scales returns and drawdowns together. The deployed short runs roughly 1× its own gross; the deployed long is sized separately.
- Entries fill at the close-plus-one-hour bar, never on the signal bar itself.
- Stops fill at the worst price the bar actually traded, capped at 10% past the trigger. Never the friendly midpoint.
- Costs: ~15 bps round trip as a taker, then re-run at triple that to make sure it still holds up.
- Funding charged to the actual exit, not the planned one.
- No feature is allowed to use anything it couldn't have known at the moment of the decision.
- In-sample, on paper and demo, no real money yet. The forward test is what judges it from here.
It goes into forward testing now, real time, paper. We're running a backtest-paper-demo reconciliation from here.
Back to Ideas