This started with something I kept noticing across my years of discretionary trading. Patterns repeated from day to day: certain hours looked more alive than others, certain shapes on the chart kept seeming to matter. At one point I wrote a small program that bucketed a year of trades by minute of the day, then by hour, then by weekday, and summed the cumulative P&L in each bucket. Clear patterns fell out. Some buckets were reliably greener than others. Coincidence, or something real? I genuinely could not tell.
What I could tell was that I did not trust it enough to size into it. Something happening before is not the same as it happening again, and my paper-trading setup then was nowhere near good enough to settle the question. That gap, between an interesting pattern and something I would actually risk money on, is most of what this project turned out to be about.
Wanting a real signal
My first momentum signal was barely a signal. Sorted by recent return, it handed me roughly the top gainers and losers you could read straight off CoinMarketCap, and a list everyone can see for free is not an edge. It also raised the question that still sits under the whole thing: if a name has already run a long way, why should it keep going? Often there is more reason to fade the move than to chase it. The large, liquid coins tend to trend; the small ones tend to snap back. Whatever I built had to respect that difference rather than paper over it.
So I read more, a fair amount of Cliff Asness and AQR on momentum and value, and tried to work out what survives contact with crypto. The frameworks hold up in equities and commodities, but crypto is a rougher room. Most alts are still dragged around by BTC, and a meaningful share of the tape is simply manufactured. I could borrow the shape of the ideas; I could not borrow the assumption that the inputs were clean.
The composite score
The detector ranks a universe cross-sectionally every cycle, and the number it ranks on is a deliberately small composite. The base is time-series momentum: each coin's own log-price change over a lagged window, divided by its own recent realised volatility. The volatility term is the point. It rewards a name that has moved cleanly over one that drifted the same distance while thrashing around. Skipping the few most recent bars keeps the freshest, noisiest candle from setting the score.
That raw number means nothing on its own, so it never gets compared to zero. Each cycle it becomes a cross-sectional z-score, momentum measured against the rest of the universe rather than in isolation, and that relative reading is clipped at a few standard deviations so one absurd print cannot run away with the leaderboard. Time-series momentum decides how a name is moving; relative momentum decides whether that is interesting next to everything else moving at the same time.
On top of that sits curvature: the second difference of smoothed returns, a read on whether a move is accelerating or rolling over. I wanted it to matter more than it does. Weighted heavily it just chased tops and added noise, so it earned a small weight and a tight clip and now acts as a timing nudge, not a rank driver. The composite is mostly relative momentum with a thin curvature overlay, plus a small bonus for names that hold their leadership across consecutive closes instead of spiking once and disappearing.
What goes into the rank
- Time-series momentum: volatility-adjusted log-return over a lagged window; the core of the score.
- Relative momentum: that momentum z-scored across the universe each cycle, then clipped.
- Curvature: acceleration of smoothed returns, held to a small weight as a timing aid.
- Hurst: a trend-persistence estimate, used as a hard filter rather than a weighted term.
- Persistence: a small bonus for names that stay near the top across confirmed bars.
Hurst is the one I keep pointing to, because settling what it should do took the longest. It estimates whether a series trends or mean-reverts, and my instinct was to fold it into the composite as another weighted factor. That was wrong. Strong momentum with a low Hurst is exactly the trap, a sharp move with nothing persistent under it, and averaging that into a score just lets loud momentum buy back the points Hurst was trying to take away. So it became a gate, not a term: below the cutoff a name is dropped no matter how good its momentum looks. Some of the most useful work here was moving a feature out of the score and turning it into a filter.
Regime, not gates
BTC sets the weather, so two macro inputs sit above the ranking. A BTC regime score, zero to three, adds a point each for price above its long EMA, a rising medium EMA, and calm realised volatility. A dominance reading, built from a futures proxy since clean spot dominance is not in the data I have, collapses into a falling / neutral / rising state. Early on I let dominance hard-veto signals, and it quietly killed real ones. Now both inputs move the score floor a name has to clear instead of blocking it outright. A weak backdrop just demands a stronger signal; it does not pretend nothing is happening.
Intrabar versus confirmed
The same engine runs twice. One pass ranks on the live, still-open candle and is allowed to be early and noisy; the other ranks only on closed 15-minute bars and is the read I actually trust. The intrabar side does not treat every top-ranked flicker as a breakout. A name has to show up repeatedly, with improving rank and a rising composite, before it graduates from a watchlist note to an emerging signal, and again before it reaches the tier I would consider acting on early. Crucially, the provisional prices never touch the confirmed history; letting a half-formed candle leak into the close-confirmed series would quietly poison the one number I lean on.
A fixed universe
The universe is a hand-maintained list, and that is a deliberate step down in sophistication. The reason is on the chart below.
SIREN · previously a top-40 coin by market cap, listed across major exchanges
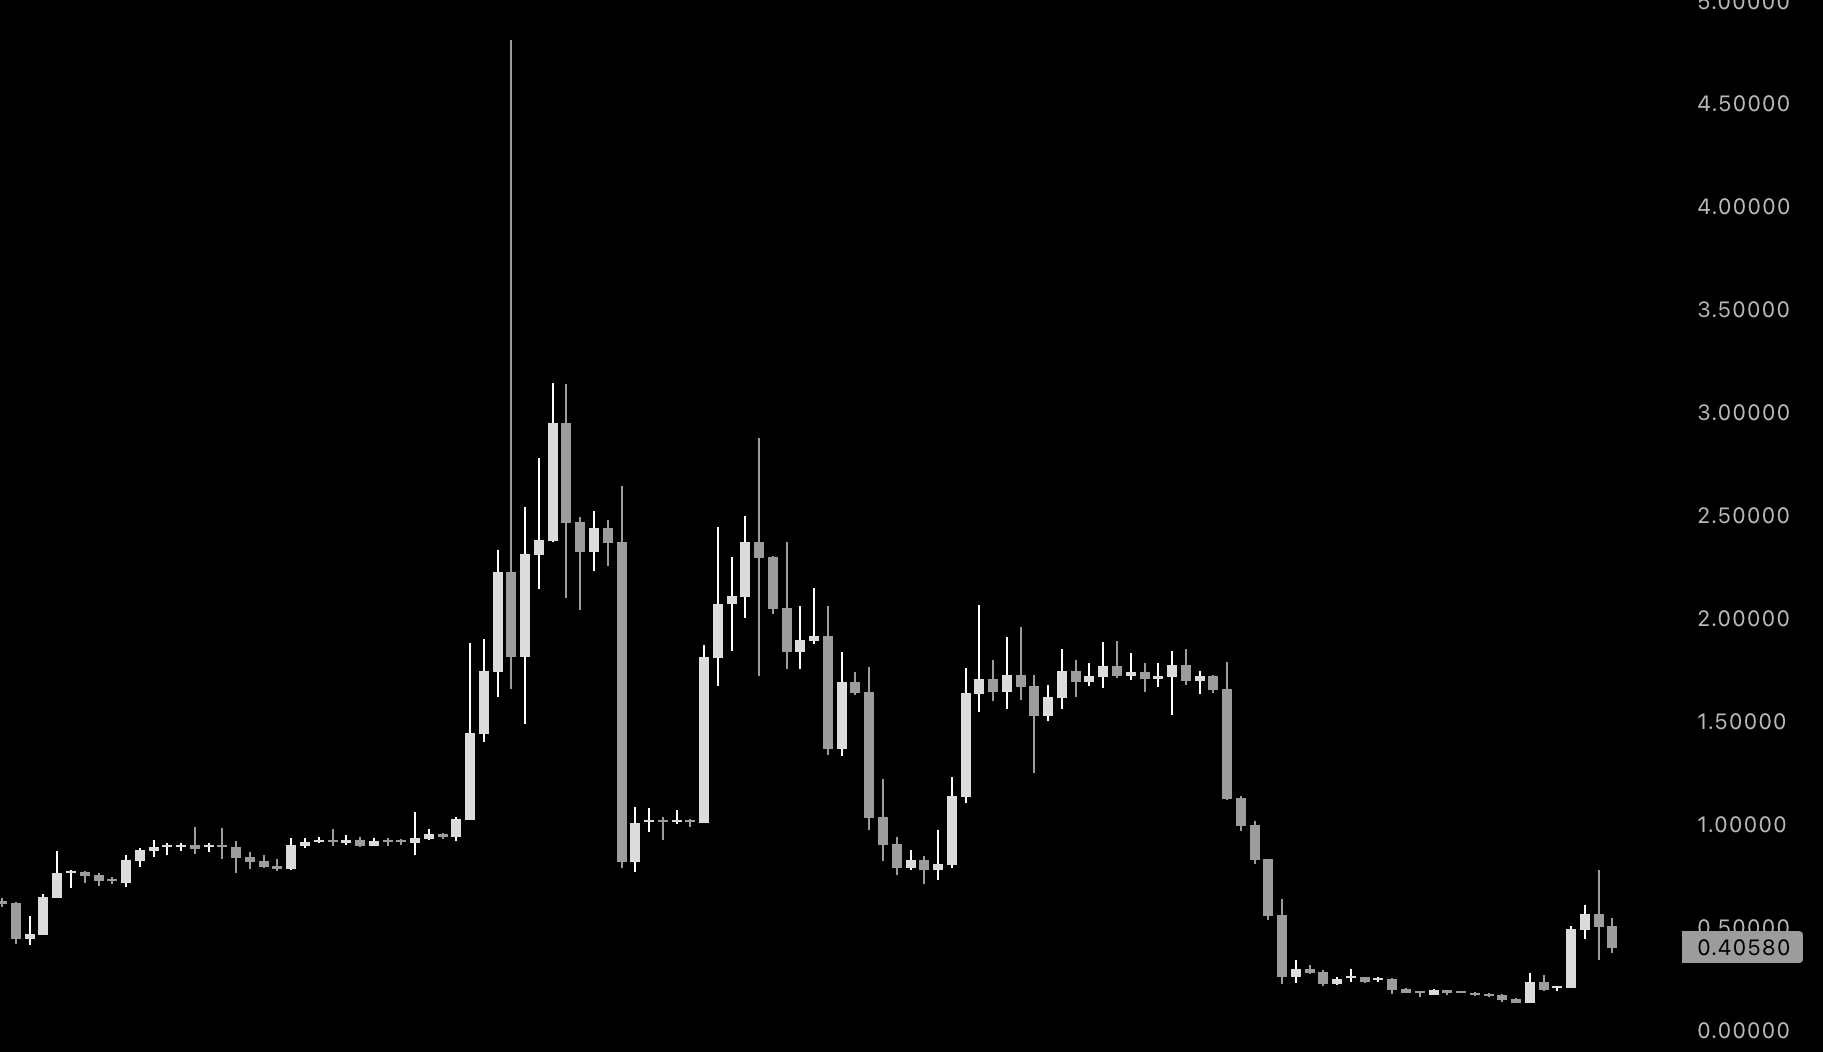
SIREN was not a forgotten micro-cap. It was a large, widely listed name, available almost everywhere, and the tape still looked like pure manipulation. Automated universe selection mostly leans on liquidity and market cap as a proxy for "real," and SIREN is the standing argument that the proxy can be wrong at size. I would rather curate a smaller list I can reason about than hand that call to a filter trusting the very numbers being gamed. Value got the same treatment: in crypto it is hard to define without stitching together activity, revenue, and on-chain proxies, so instead of forcing it in to sound more complete, I left it out until I can do it honestly.
That is the standard I try to hold the whole thing to: a feature earns its place by measurably improving the detector, not by making the method sound advanced. Curvature nearly did not survive it. Value has not made the cut yet. Hurst only stayed by changing jobs. If something does not move the output, it does not belong in the code.
Testing
Most of the real work has been testing. I run parallel instances on rented VPSs, let them log every evaluated row to SQLite, and go back through the output by eye a day or two later. A replay harness drives the actual engine over recent Bybit history rather than a separate backtest path, so what I review is the same code that would run live, and the test suite stays green at every change. It is slow and a little tedious, and I trust it far more than a clean first backtest, which is usually just a bug I have not found yet.
I never wanted a system that only wakes up when a bar closes, but I did not want one that re-ranks on every WebSocket tick either. A short settle delay before each cycle and a throttle on the intrabar pass are the compromise: constantly observing, rarely alerting. There is no perfect architecture here, only tradeoffs you understand and tradeoffs you do not.
Where it stands
Outlier Detector is a detector, on purpose. Execution, position management, sizing, and the rest of a real trading system are deliberately out of scope until I trust the signal underneath them. It is still a work in progress, and that is fine. Building the part I can verify first is the only version of this that does not quietly fall over later.
Back to Ideas